Throughput Evaluation for Hierarchical graphs
Tutorial created the 10.02.2017 by H. Deroui. Last update the 10.06.2017.
Interface-Based SDF (IBSDF) MoC
The Interface-Based SDF (IBSDF) MoC [1] is a hierarchical extension of the SDF MoC. In the IBSDF MoC, the internal behavior of actors can be specified either with host code, as it is with SDF, or with IBSDF subgraph. The hierarchy mechanism of the IBSDF MoC is based on interfaces that ensure a compositionality free of deadlock.
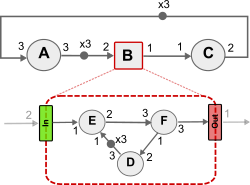
The upper figure shows an example of IBSDF graph in which actor B is a hierarchical actor described by the SDF subgraph DEF. Each input/output port of the hierarchical actor B has an associated input/output interface in the subgraph.
Throughput Evaluation of IBSDF Graph
In the design of real-time signal processing applications, the throughput is one of the required properties to be evaluated as early as possible by the developer [2]. That is why Preesm includes a dedicated plugin for the throughput evaluation of IBSDF graphs. In this section, we briefly describe the evaluation methods supported by Preesm and the specifications of the throughput evaluation plugin.
Throughput Evaluation Methods
Preesm supports the following methods:
- Classical method [2]: consists of flattening the hierarchy of an IBSDF graph into a big flat Single-Rate SDF (SrSDF) graph and then computing its throughput by state-of-the-art methods of SDF graphs. For a large graph, this method may fail to return a result.
- Schedule-Replace (SR) technique [2]: consists on scheduling each subgraph in the hierarchy, one at a time and level by level, to define the duration of hierarchical actors. Next, the method evaluates only the throughput of the top-graph to define the throughput of the IBSDF graph. Since the flattening process is avoided, this method outperforms the classical one.
- Evaluate-Schedule-Replace (ESR) method [3]: is based on a relaxed execution of the IBSDF graph to evaluate more efficiently the throughput. A comparison between ESR, SR, and the classical method can be found in [3].
- Hierarchical Periodic Schedule (H-Periodic): is based on a global 1-Periodic schedule for IBSDF graph. The throughput is computed as 1 over the maximum execution period of actors.
Throughput Evaluation Plugin

The throughput evaluation plugin takes an IBSDF graph and a Presm scenario as inputs to compute the throughput. Once the plugin finishes the computations, it returns the value of the throughput of the given graph as an output. The evaluation method used by the plugin needs to be defined as the value of the variable “method”. Detailed specifications are shown in the following table:
| Plugin Id | org.ietr.preesm.throughput.ThroughputPlugin |
| Inputs | Description |
| IBSDF graph | The IBSDF graph to evaluate. Type: org.ietr.dftools.algorithm.model.sdf.SDFGraph |
| scenario | The scenario contains the duration of actors execution. Type: org.ietr.preesm.core.scenario.PreesmScenario |
| Outpus | Description |
| Throughput | The returned value of the throughput. Type: java.lang.Double |
| Task Variables | Description |
| method | Defines the method to use for the throughput evaluation. Type: java.lang.String; Possible values: “Classical”, “SR”, “ESR”, “HPeriodic” |
Workflow Example
In this section, we illustrate how to use the throughput evaluation plugin by a project example that evaluates the throughput of the IBSDF graph example of the first section.
Download and Set up the project
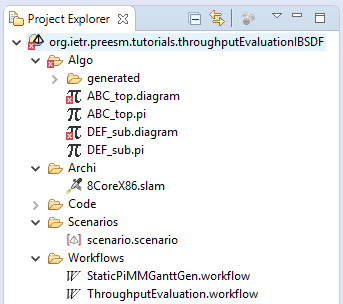
Download the project example from here and import it in Preesm. The Project Explorer should contain the following elements:
Check the content of the project
The files “ABC_top.diagram” and “DEF_sub.diagram” in the folder “\Algo\generated\” represents the IBSDF graph to evaluate in this project. You can check that actor B is hierarchical by verifying the value of its “Refinement” property, it should be indicating the name of the subgraph as shown in the image below.
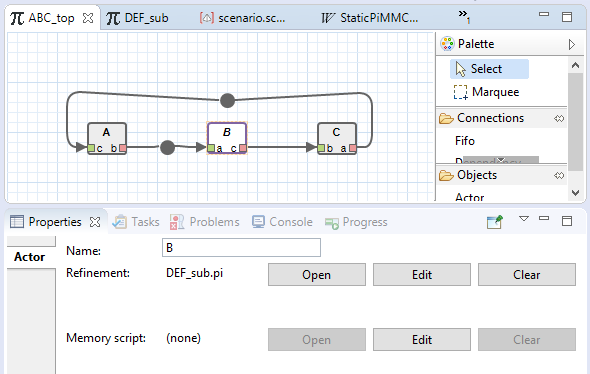
Note that for the atomic actors A, C, D, E, and F the refinement property is empty while it should be pointing to the source code file. That’s for eclipse shows some errors in the “Problems” tab. You can ignore these errors since the project evaluates only the throughput of the graph and does not generate the final source code of the application.

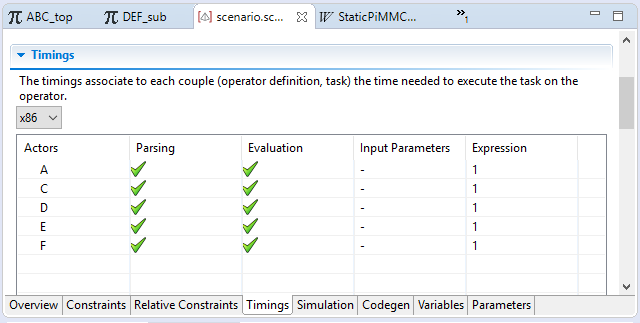
The architecture of the target machine defined by the SLAM file “\Archi\8Corex86.slam” is used only to define the duration of actors execution. You can modify the duration value of an actor by opening the scenario file “Scenarios\scenario.scenario” and changing the value of the “Expression” property of the actor in the “Timings” tab. In this project, all atomic actors have a duration equal to 1.
The “\Workflows” folder contains two workflows, “ThroughputEvaluation.workflow” and “StaticPiMMGanttGen.workflow”. The first workflow is already set up and ready to be executed to test the throughput evaluation plugin. The second one will be used in this tutorial to show how to add a throughput evaluation task to an existent workflow.
Execute the workflow test

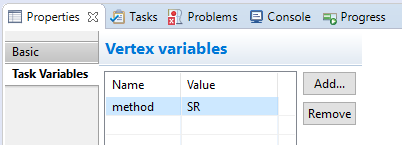
The “ThroughputEvaluation.workflow” workflow consists of taking an IBSDF graph and computing its throughput using the Schedule-Replace (SR) technique. You can choose another method by changing the value of the “method” variable of the “ThroughputEvaluation” task in the Properties->Task Variables tab of the task according to the specifications of the plugin.
To test the throughput evaluation plugin, execute the workflow following the procedure presented in tutorial1. During the execution of the workflow, you should see messages in the “Console” tab almost like in the image below.

If the IBSDF graph is deadlock free, the throughput evaluation plugin will print the value of the throughput as the number of iterations per clock-cycle and the time that the method took to compute the throughput. If the IBSDF graph is deadlock an error message will be printed. In this project, the throughput of the IBSDF graph example is 1/8 iteration per clock-cycle as shown in the upper image.
Note that the throughput evaluation plugin ignores the execution of interfaces by setting their duration to zero. As consequences, some warning messages may be printed in the Console tab.
Add the throughput evaluation task to an existent workflow

To illustrate how to use the throughput evaluation plugin in an existent workflow, we will use the second workflow “StaticPiMMGanttGen.workflow” as an example. Follow the steps below to add a new throughput evaluation task to the workflow example:
- (1) Open the “StaticPiMMGanttGen.workflow” workflow.
- (2) Add a new Task vertex to your workflow and name it “ThroughputEvaluation”. To do so, simply click on “Task” in the Palette on the right of the editor then click anywhere in the editor.
- (3 ) Select the new task vertex. In the “Basic” tab of its “Properties”, set the value of the field “plugin identifier” to “org.ietr.preesm.throughput.ThroughputPlugin”.

- (4) In the “Task Variables” tab of its “Properties”, add a new variable and name it “method”. Then set its value to one of the values indicated in the specifications of the throughput evaluation plugin. By default, the SR technique “SR” is used.

- (5) connect the new task to the “scenario” task vertex and to the “StaticPiMM2SDF” task vertex as shown in the figure below.
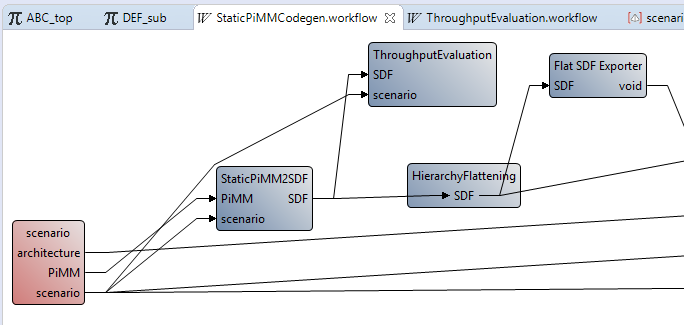
Now you can run the workflow and check the execution of the “ThroughputEvaluation” task in the Console tab. The new task should display the same message as in the previous workflow.
References
[1]. Jonathan Piat, Shuvra S. Bhattacharyya, Micka¨el Raulet. Interface-based hierarchy for synchronous data-flow graphs. Signal Processing Systems, 2009. SiPS 2009. IEEE Workshopon, Oct 2009, Tampere, Finland. pp.145-150, 2009, <10.1109/SIPS.2009.5336240>.
[2]. H. Deroui, K. Desnos, J. F. Nezan and A. Munier-Kordon, “Throughput evaluation of DSP applications based on hierarchical dataflow models,” 2017 IEEE International Symposium on Circuits and Systems (ISCAS), Baltimore, MD, USA, 2017, pp. 1-4. doi: 10.1109/ISCAS.2017.8050774
[3]. Hamza Deroui, Karol Desnos, Jean-Fran¸cois Nezan, Alix Munier-Kordon. Relaxed Subgraph Execution Model for the Throughput Evaluation of IBSDF Graphs. International Conference
on Embedded Computer Systems: Architectures, Modeling, and Simulation (SAMOS), Jul
2017, SAMOS, Greece.